Limited visibility of capacity
Idle periods and differences between equipment do not always reach management.

DICOM Metrics
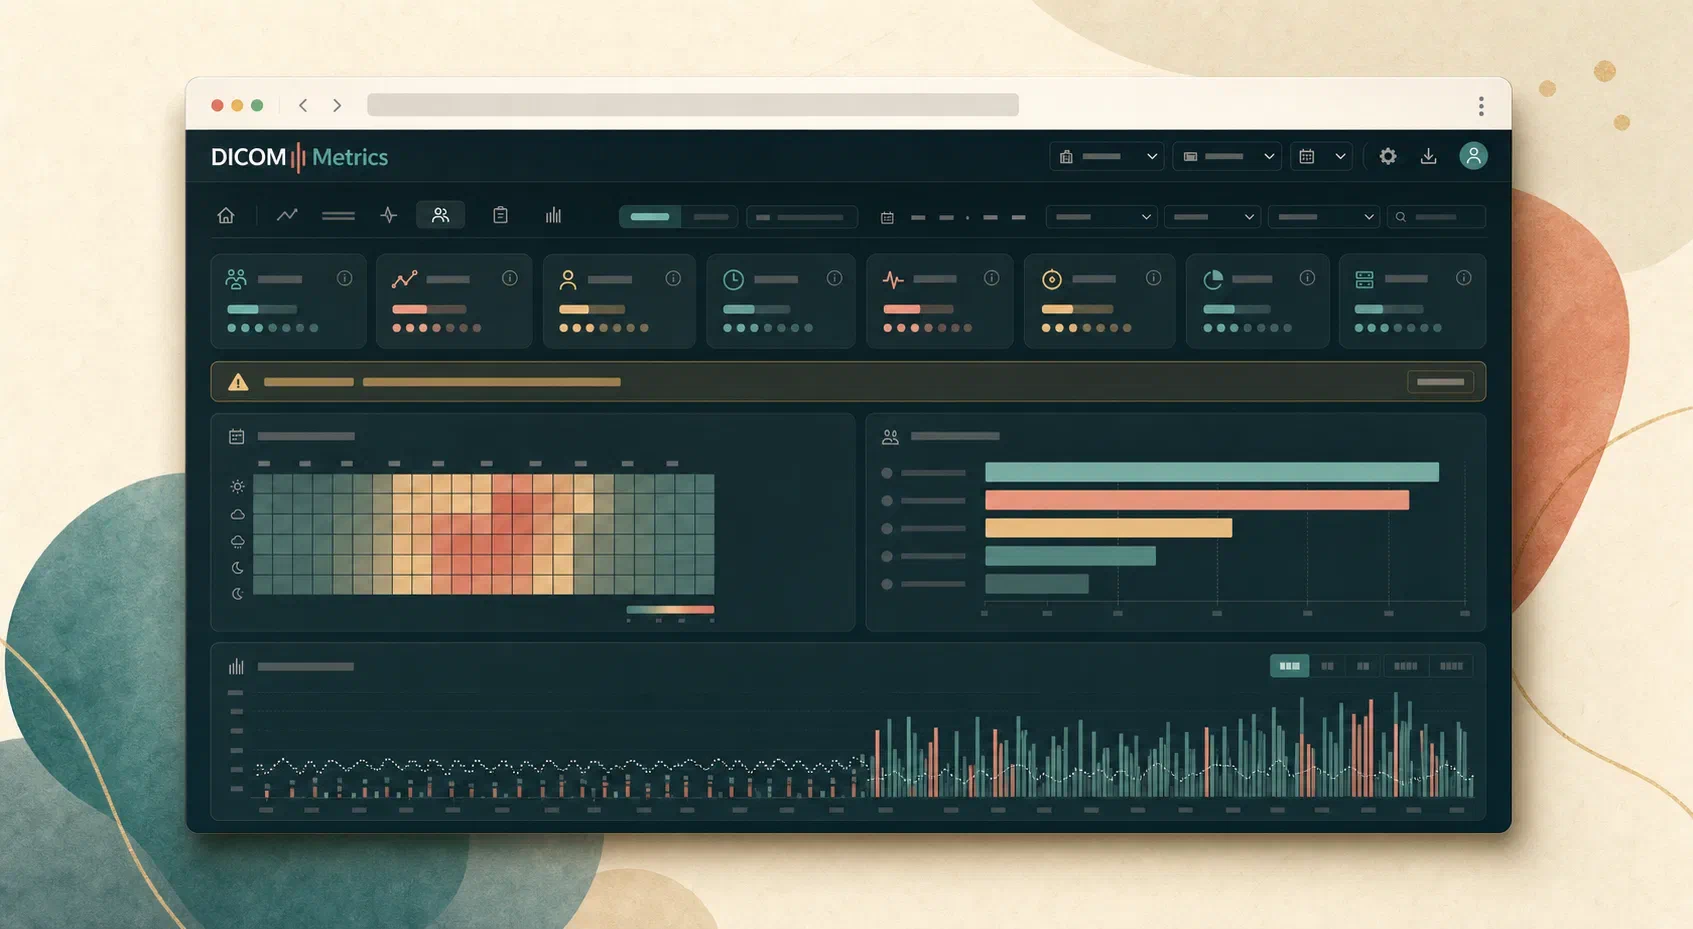
Analytics for medical imaging services, turning operational data into a clear view of productivity, workflow, demand, and quality.
Data you already have
Every exam leaves information in the PACS about times, modality, equipment, institution, and staff. When these metadata remain restricted to technical systems, understanding the operation depends on spreadsheets and isolated perceptions.
DICOM Metrics organizes these records into automatically updated indicators so managers and teams can recognize patterns, investigate changes, and decide with more context.
What usually stays out of reach
Idle periods and differences between equipment do not always reach management.
Manual consolidations show what happened but may not explain yesterday’s bottleneck.
Staffing and expansion require an integrated view of demand and available capacity.
How it works
The platform connects to the existing environment and transforms technical metadata into understandable operational information.
Integration uses DICOMweb or a connection compatible with the available infrastructure.
Times, modalities, equipment, and required records are organized without displaying exam images.
Volume, duration, wait time, utilization, and intervals are updated automatically.
Dashboards, filters, and PDF reports bring data closer to everyday decisions.
What becomes visible
Volume, duration, utilization, and essential indicators in an automatically updated dashboard.
Find incomplete records, inconsistent times, and information that needs verification.
Understand how volume is distributed among professionals, shifts, and equipment.
Track waiting, procedure time, and pauses between exam stages.
Observe seasonality and peak times to plan capacity.
View the time between the exam and report delivery by team and modality.
Decisions supported
A shared view helps different areas discuss the operation from the same context.
Management
Compare demand, shifts, and utilisation before revising rosters or expanding the facility.
Technical coordination
Look at times, intervals, and workload distribution to guide adjustments and training.
Quality
Separate technical inconsistencies from operational indicators and follow how they evolve.
AI-supported analysis
DICOM Metrics can summarize key findings and highlight changes, risks, and opportunities that deserve attention.
The summary relates indicators for the selected period, organizes findings by priority, suggests questions and next steps, and keeps validation with the responsible team.
Analyses depend on the quality and coverage of available data and must be interpreted in the context of each operation.
Privacy and integration
DICOM Metrics uses the metadata required to calculate indicators. Diagnostic images are not downloaded or displayed in the analytics dashboard.
The platform connects to the existing infrastructure, access profiles follow each person’s responsibility, traceability supports audits, and data processing is aligned with Brazil’s LGPD.
See it in practice
Talk to us about your infrastructure, challenges, and goals.